On June 8, the full slate of Championship fixtures was announced, with all 24 teams back in action on the weekend of June 20. Unsurprisingly, the cliché concerning the unpredictability of the Championship has already been brought out, especially in reference to the run-in for the remainder of the season. Seven points separate 4th from 11th for the last few spots in the play-offs, so this season is no different.
When analysing the Championship, many analysts lean towards the use of the expected goals metric to measure team performance. Expected goals measures the quality of chances teams have created to provide a better indicator for future performances, instead of simply looking at the results. However, through careful consideration of the underlying xG data through a comparison of the expected goals table against the actual league positions in the Championship, there are reasons to question the increasing overreliance on this metric.
REDS REVEL IN 'SABRI BALL' - NOTTINGHAM FOREST
Nottingham Forest are a perfect example of the misleading nature of expected goals. In the expected goals table Forest lie 14th and a mammoth 11 points off the play-offs spots. The reality is that they are 5th and were in an extremely strong position to consolidate their play-off place prior to the lockdown that put football on hold. What does this tell us? Well, put simply, Forest are overperforming their expected goals. Yet many have praised Forest for their hard work, cohesion and tactical nous with many believing that they have been more than deserving of their place in the top six so far. In fact, Sky Sports released an article on March 7 asking their pundits who had been their manager of the season. Three of their six pundits went with Forest’s charismatic Frenchman Sabri Lamouchi as manager of the season.
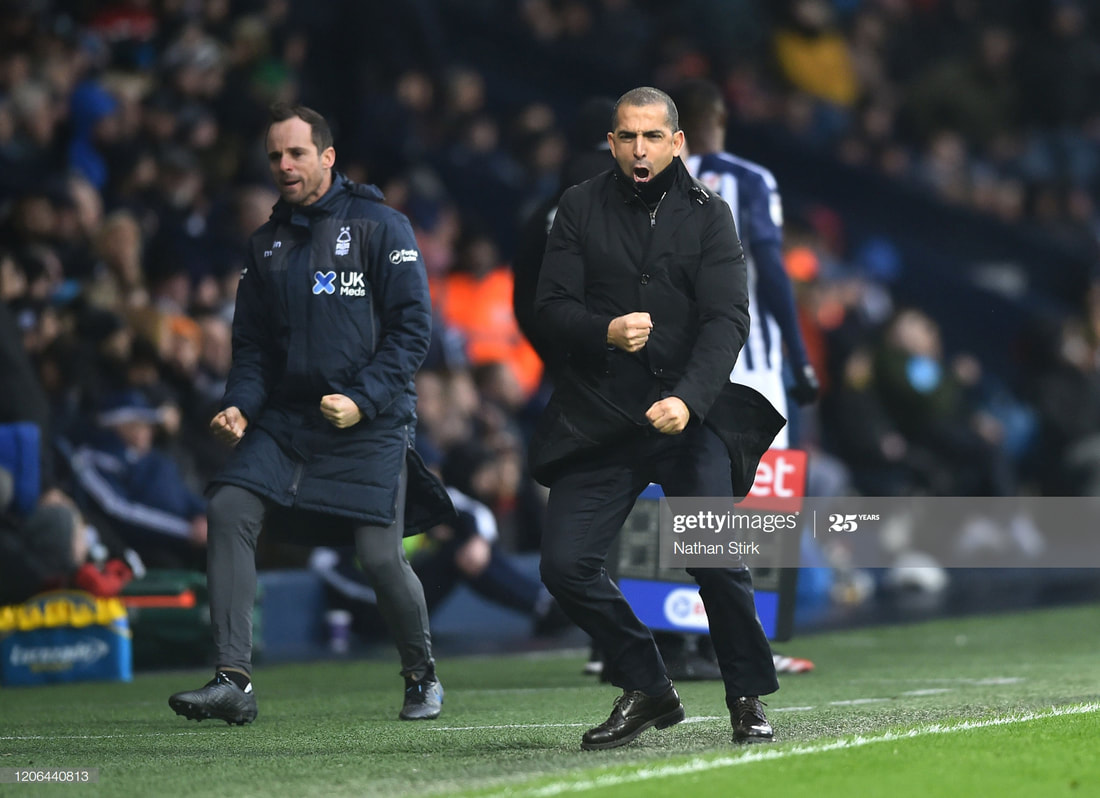
Lamouchi is the seventeenth different man to take charge of Forest since 2010, but the Frenchman has impressed Nottingham so far, and his side are currently fifth.
The Reds’ style of play is a low block with reliance on speed, individual quality and clinical finishing by their talisman Lewis Grabban on the counterattack. Their away performances have been particularly notable and their overperformance of xG is highlighted on their travels.
An example of this was their 1-0 win at Brentford in January where the xG data told a different story to the actual pattern of the game. Brentford’s xG for this game was 1.13 in comparison to Forest’s 0.79. Brentford, who have been dubbed ‘the kings of xG’ are synonymous with this metric as their ownership rely heavily on analytics-driven recruitment to improve their expected goals data. They also sit second in the expected goals table and, ultimately, their style of play of long periods of possession lends itself to the build-up of xG. Brentford’s point tally of 76, in comparison to Forest’s 48 points in the xG table highlights the massive gulf between the teams when looking at this metric. However, a closer look at this game tells a different story to the expected goals data.
Forest took an early lead through Lolley and were unfortunate not to add a second as Grabban missed a clear-cut opportunity and was harshly denied a penalty. Brentford, on the other hand were limited to long range shots and only registered one more shot on target than Forest throughout the 90 minutes. Lamouchi even described the evening as ‘comfortable’ as Forest enjoyed only 42% of the ball and secured a vital away win against their promotion rivals.
There have been countless examples of Forest overperforming their xG this season showing that their style and the sustainability of it is no fluke. In a 3-2 win at Stoke that sent Forest top of the Championship for the first time in the season, Forest had only 1.30 xG, in comparison to Stoke’s 1.86. Other such instances include the 2-2 draw at second placed West Brom where they had only 0.74xG, in comparison to Albion’s 1.86. Perhaps the most telling example of ‘Sabri ball’ though was the 2-1 win at Fulham where they not only had less xG than Fulham but also only had a miniscule 23% of possession.
This performance was one of many Lamouchi masterclasses this season that highlighted the importance of nullifying opposition strengths and defending in numbers to string effective counter attacks. This system has proved problematic at times for the Reds when they come up against teams that sit back against them. However, overall Forest have reaped the rewards of a system that has made them hard to beat and efficient, as opposed to the data driven approach of teams such as Brentford who they are level on points with.
GOALS FROM EVERYWHERE - BRISTOL CITY
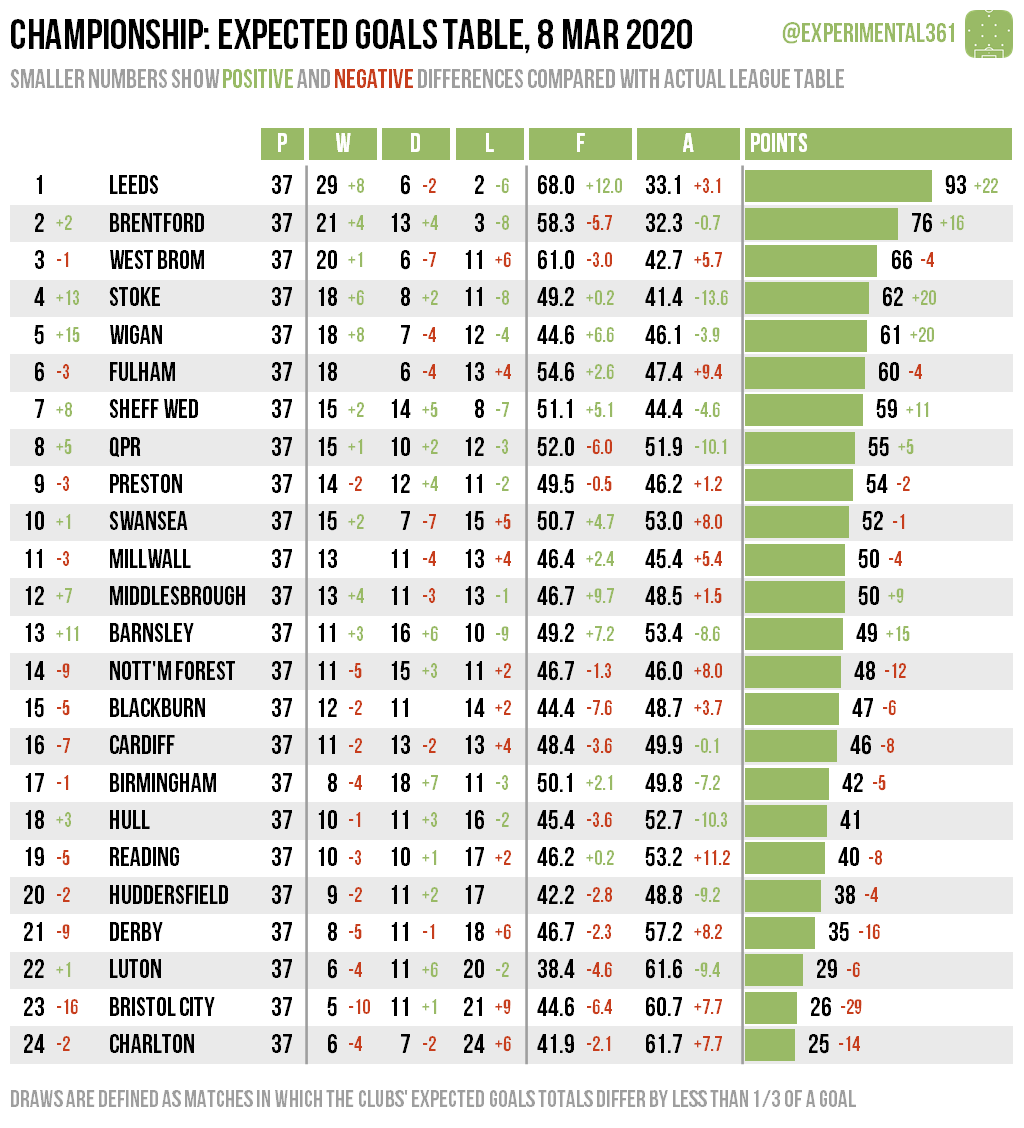
An even more extreme example of a team overperforming their expected goals data is Bristol City. In the Championship league table, the Robins lie seventh, just a point outside the play-off places, and are undoubtedly in promotion contention. However, the expected goals table paints an entirely different story. Bristol City are 23rd in the expected goals table and are 29 points worse off than their actual tally. This includes 44.6 goals predicted in the xG model, 6.4 goals worse than the amount of goals they have scored.
When delving deeper into their share of goalscorers this season, there are clear signs to highlight the lack of creativity which has led to their astonishingly low xG tally. Famara Diedhiou and Andreas Weimann have 19 goals between them this season, which is 38% of the goals they have scored. Their 4-4-2 system has been the most popular this season with the aforementioned strikers occupying the two forward roles. Lee Johnson (Bristol City manager) has had to find creativity through alternative routes rather than simply supplying the front two in open play.
This is where alternative goalscoring methods come in. 27% of their goals this season have come from set pieces and in their most common back four, consisting of Jack Hunt, Ashley Williams, Nathan Baker and Tommy Rowe, there has been a goalscoring output of five. In fact, Bristol City have had a staggering 17 different goal scorers in the Championship which means they are the eighth highest scoring team in the division after 37 games, even with their incredibly low xG output.
Bristol City are also extremely effective at using their wide players to supply their clinical front two. Nicolas Eliasson, who occupies the left wing for the Robins has provided the most assists (12) for the team this season. On the opposite flank, right back Jack Hunt and right winger Josh Brownhill have provided an additional seven assists for City. A closer look at their attacking patterns shows their emphasis on using wide areas to their advantage. In fact, 74% of Bristol City’s attacks come on either the left or right side. Given that their top scorer Diedhou is 6ft 3 inches we can see the logic in this approach, and, like Forest, they have found a style that is efficient and has propelled them into promotion contention.
Examples of Bristol City massively overperforming their xG have been common this season. Their 2-1 away win at Derby saw them have 1.13 xG, in comparison to Derby’s 2.13 xG. In addition to this, their 1-1 draw at Millwall saw them have an extraordinary 0.29 xG to Millwall’s 2.24. There are many other examples throughout the season that show Bristol City’s constant inferiority when it comes to xG, yet they have been able to churn out points consistently.
GOALS FROM EVERYWHERE - BRISTOL CITY
An even more extreme example of a team overperforming their expected goals data is Bristol City. In the Championship league table, the Robins lie seventh, just a point outside the play-off places, and are undoubtedly in promotion contention. However, the expected goals table paints an entirely different story. Bristol City are 23rd in the expected goals table and are 29 points worse off than their actual tally. This includes 44.6 goals predicted in the xG model, 6.4 goals worse than the amount of goals they have scored.
When delving deeper into their share of goalscorers this season, there are clear signs to highlight the lack of creativity which has led to their astonishingly low xG tally. Famara Diedhiou and Andreas Weimann have 19 goals between them this season, which is 38% of the goals they have scored. Their 4-4-2 system has been the most popular this season with the aforementioned strikers occupying the two forward roles. Lee Johnson (Bristol City manager) has had to find creativity through alternative routes rather than simply supplying the front two in open play.
This is where alternative goalscoring methods come in. 27% of their goals this season have come from set pieces and in their most common back four, consisting of Jack Hunt, Ashley Williams, Nathan Baker and Tommy Rowe, there has been a goalscoring output of five. In fact, Bristol City have had a staggering 17 different goal scorers in the Championship which means they are the eighth highest scoring team in the division after 37 games, even with their incredibly low xG output.
Bristol City are also extremely effective at using their wide players to supply their clinical front two. Nicolas Eliasson, who occupies the left wing for the Robins has provided the most assists (12) for the team this season. On the opposite flank, right back Jack Hunt and right winger Josh Brownhill have provided an additional seven assists for City. A closer look at their attacking patterns shows their emphasis on using wide areas to their advantage. In fact, 74% of Bristol City’s attacks come on either the left or right side. Given that their top scorer Diedhou is 6ft 3 inches we can see the logic in this approach, and, like Forest, they have found a style that is efficient and has propelled them into promotion contention.
Examples of Bristol City massively overperforming their xG have been common this season. Their 2-1 away win at Derby saw them have 1.13 xG, in comparison to Derby’s 2.13 xG. In addition to this, their 1-1 draw at Millwall saw them have an extraordinary 0.29 xG to Millwall’s 2.24. There are many other examples throughout the season that show Bristol City’s constant inferiority when it comes to xG, yet they have been able to churn out points consistently.

In the nearly three seasons for which he has played for Bristol City, Senegalese international Diedhiou has scored 36 Championship goals.
THE xG UNDERPERFORMERS - STOKE CITY AND WIGAN ATHLETIC
So far, we have looked at the cases of Bristol City and Nottingham Forest to show that the perceived notion of unsustainable expected goals statistics is misleading when looking at both teams. There are teams at the other end of the scale that offer a neat contrast. Stoke City and Wigan Athletic sit 17th and 20th in the Championship table respectively, with both teams’ seasons plagued by inconsistency.
However, the expected goals table places both Stoke and Wigan in the play-off places in 4th and 5th. Stoke’s huge problem this season has been conceding goals and, more specifically, protecting leads. In terms of goalscoring they have been nearly identical to their xG tally, as they have scored 49 goals and their xG for the season is 49.2. However, the big difference comes in the goals against column where they have an xG of 41.4 goals against. The reality is that they have conceded 55 goals. They don’t do lots of defending for a team in their position, but when they do, they are extremely vulnerable.
Examples of Stoke losing their lead, especially late in the game, underpins their season so far. Even with the new manager bounce of Michael O’Neill who has guided them away from desperation and will most likely keep Stoke up, there has still been games where they have let a lead slip in the late stages of the game. Under O’Neill, the QPR and Luton away games jump out as the most striking examples of this. At QPR they led 2-0 after 31 minutes, only to end up losing the game 4-2 and after leading 1-0 away at relegation rivals Luton they conceded a 91st minute penalty to squander two more points.
However, Stoke’s constant relinquishing of leads was more commonplace early in the season, particularly under the stewardship of Nathan Jones. A 2-2 draw with Derby on the third game of the season was symbolic of Stoke’s troubles this season. With an xG superior by over one goal and dominating Derby statistically, Stoke conceded a 70th minute equaliser after being 2-1 up and creating numerous chances against a competent side. Stoke’s 2-1 loss away at Birmingham was also a reminder of their defensive fragility. After leading 1-0 with 17 minutes to play, Stoke conceded two goals in as many minutes after limiting a free-flowing Birmingham City attack prior to the late onslaught.
Wigan provide us with the next example of a team underperforming their expected goals statistics. Yet, their problem is scoring goals which is very different to Stoke and their defensive issues. Wigan are an extraordinary 15 places above their actual league position in the expected goals table. Ultimately, this tells us that Wigan have been creating numerous chances and a breakdown of their statistics depicts a blunt goalscoring output. In fact, you don’t have to look much further than their top goalscorers in the league so far. Wigan’s main striker Kieffer Moore has notched six goals, and remarkably sits alongside central defender Che Dunkley at the top of Wigan’s goalscoring charts. The astonishing part of this statistic is that Dunkley has only started 22 of Wigan’s 37 league games.
Wigan’s goalscoring output of 38 is the second worst in the league, only one better than Jonathan Woodgate’s struggling Middlesbrough side. Considering they have an xG of 44.6, there is clearly no problem with creativity, and they have dominated games statistically like Stoke without getting results. In December their 1-1 draw against second placed West Brom saw them have an xG of 2.40 compared to West Brom’s 0.60. Perhaps the key point here is that xG is accurate in predicting a team’s ability to create chances and sometimes accurate in highlighting the dominant team in a match. However, xG is unable to account for a team’s inability to finish off these chances due to their lack of a natural finisher and decisive personnel occupying attacking roles. The fact Charlie Austin smashed in an equaliser in this game is ironic, given that he is the exact type of player Wigan are missing. Expected goals doesn’t tell you this.

Paul Cook's Wigan have struggled to put the ball in the net this season, and his side sit just two points clear of the relegation zone.
LEADERS ON BOTH FRONTS - LEEDS UNITED
Some may argue that the expected goals table is accurate in the placement of Leeds at the top of the table. This is a valid debate, but when you breakdown the expected goals figures for Leeds, it is important to not to take them at face value. Many agree that Leeds are the best team in the Championship, in large part down to the management of Marcelo Bielsa and vital players in key areas such as Ben White, Kalvin Phillips and Pablo Hernandez. Despite this, the extent of their dominance in the xG table is quite drastic in comparison to the reality.
The xG table has Leeds boasting a points tally of 93 points which is 22 clear of their actual points total. This is largely down to their aggressive pressing style and quick passing interplay which leads to dominant performances, especially against teams that sit back. Nevertheless, like Wigan, Leeds have struggled for a consistent end product to finish off all these chances created. Their top goal scorer, Patrick Bamford, has scored 13 goals this season, which on paper looks like a solid tally. Yet, his individual expected goals is 24.91 and his struggles early in the season were well documented, especially with the talented young Arsenal loanee Eddie Nketiah sitting on the bench.
When Leeds experienced a significant drop off in January, an article in the ‘Football Critic’ looked at the Bamford problem as a reason for this. Their analysis of Bamford was that:
“if a forward is underperforming xG in a short period, it is a good thing; often being in the positions to miss the chances is far less of a concern than not being there at all. But at what point do we call this less of a symptom and more of a disease?”
This has been a genuine problem for Leeds this season and caused divide in their fan base. Bielsa’s persistence in playing Bamford and snubbing of the exciting Nketiah was seen in a press conference in October where he stated that:
“Nketiah is very good at scoring. Also, Bamford but Bamford is missing chances. But there's a fact about what happens before you score a goal. You build a situation that allows the chance."
Yet again, expected goals data doesn’t show you this and provides us with another example of why we shouldn’t be over-reliant on it when analysing Championship teams. If we simply looked at xG stats and the xG table to analyse teams then we would be wide of the mark. Of course, it has its advantages and gives us a more in-depth statistical analysis of games, instead of simply looking at shots on and off target. The analysis of the major underperformers and overperformers of expected goals in the Championship highlights the problems in looking at it as a truly reliable guide for when the Championship returns on June 20. It will be interesting to see how the above teams perform after the prolonged break, and to see if their patterns of statistical performance remain.
It will undoubtedly be a dramatic end to the season in the Championship at the top and bottom and it is a huge relief that matters can be settled on the pitch, unlike League’s One and Two. Just watch out for that xG.
Written by - Will Murray
Edited by - 3-At-The-Back
Edited by - 3-At-The-Back
